What are GHGs and how are they connected to climate change?
A lot of things we do each day use energy. Right now, the way we produce energy emits greenhouse gas emissions (GHGs). Activities like heating and cooling our homes and offices, getting rid of waste, and driving cars, buses, and trucks all use a lot of energy – and consequently, produce a lot of emissions. Over the last 150 years, these activities have caused the amount of greenhouse gases in our atmosphere to skyrocket.
So why is this a big deal?
GHGs trap heat in the atmosphere, leading to lasting disruptions to our natural climate patterns, such as higher temperatures, sea level rise, and more frequent extreme weather events (like more intense Nor-easters... no thank you!). These impacts can be costly and dangerous for people and the environment.
- Learn more about how greenhouse gases work
- Explore the impacts we're feeling right now in Danvers
How is Danvers addressing GHG emissions?
Danvers is stepping up to make sure our community can thrive despite climate change - and that means reducing emissions. The Climate Action, Sustainability, Preservation, and Resilience (CASPR) Plan in progress this year will have strategies to cut GHG emissions that are tailored to the needs and resources of our town. Across Massachusetts, our neighbors are taking steps to create climate plans and drastically shrink emissions by 2030 and 2050. Check out the climate plans for Beverly and Salem, Gloucester, Wenham and others! Danvers is joining the movement for a cleaner, healthier, and more sustainable future!
How do we get started reducing emissions?
The first step is to understand where the biggest sources of emissions are coming from. Part of the CASPR planning process is taking an inventory of all the GHGs produced within our town's borders. We're conducting both an inventory of municipal emissions, and community-wide emissions. Both inventories break down emissions by source, like natural gas or electricity, to determine the amount of GHGs coming from each source.
Where are our emissions coming from?
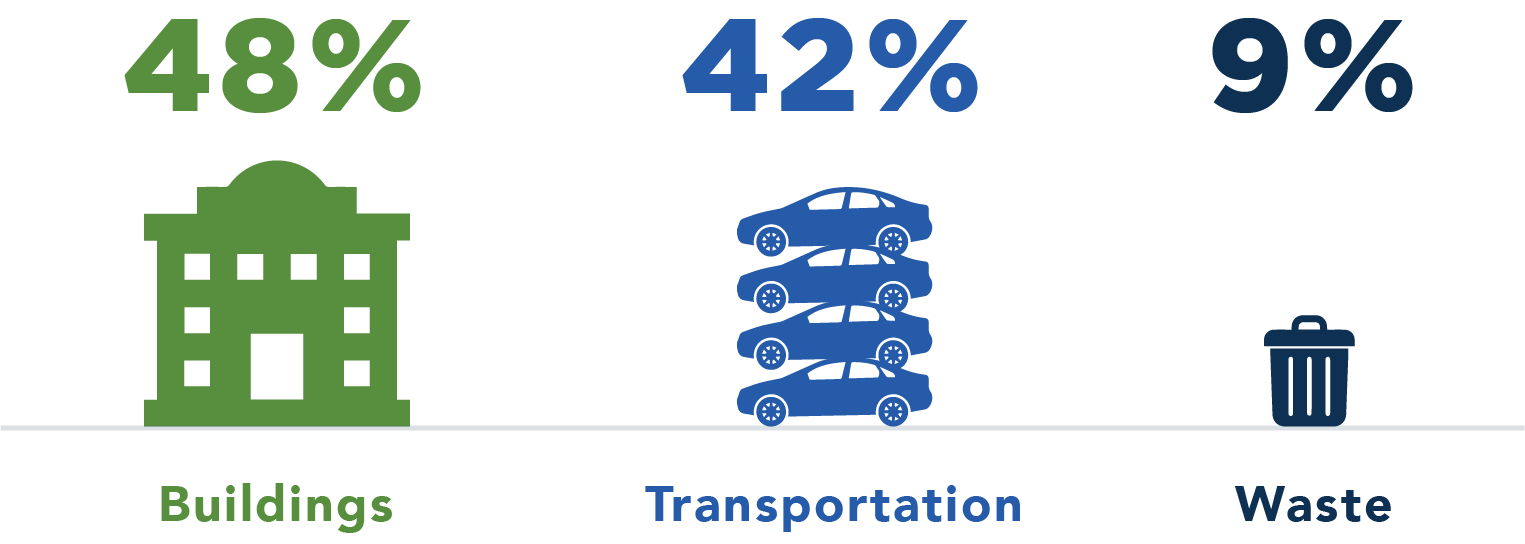
The Community-wide GHG Inventory shows us that most emissions come from transportation (44.2%), buildings (46%), and waste (9.7%). Emissions from Town government activities account for less than 1% of total emissions, and come mostly from buildings and facilities (71%), followed by vehicle fleet (25.6%), and streetlights and traffic signals (2.5%).
So, what do we do after we have a GHG Inventory?
Good question! Now that we know what activities are producing the most GHGs in Danvers (homes and cars) we'll make a plan to scale down emissions in those areas. Our CASPR plan will have strategies and actions to do this, and the Town and our community will work together to get them done. It will be important to update the GHG Inventory on a regular basis so we can measure our progress.
What YOU can do today!
- Get involved in the CASPR planning process - take our survey to share your thoughts!
- Help build the movement in Danvers for a resilient future
- Learn more about climate change in Danvers
- Keep exploring climate science and solutions
Previous Post
Climate Change & Public Health
Next Post
All About Trees in Danvers


