
Climate Change in Danvers
Start of page content
Climate change is caused by human activities that rely on burning fossil fuels which emit greenhouse gases into the atmosphere. When these emissions build up, they change climate conditions and create hazards that impact our community in many ways.
We need to take action now to prepare for a future that is safe, healthy, and sustainable - for everyone.
Our Climate Is Changing
The Greenhouse Effect
Greenhouse gases (GHGs) are essential to life on Earth. They provide a "blanket" in our atmosphere, trapping heat and regulating the Earth's temperature. However, when we burn fossil fuels to power our homes, businesses, and vehicles, we increase the level of GHGs in the atmosphere, creating a much thicker "blanket" that disrupts the Earth's climate. The result is more intense storms, flooding, and heat waves, which we are already experiencing in Danvers.
The top 2,000 climate scientists in the world have said our window for action is closing, but that we can still avoid the worst impacts of the crisis if we act quickly.*
How Does Climate Change Affect Danvers?
We Are Feeling the Impacts
In communities across the Northeast, including Danvers, we have been experiencing impacts from climate change already, such as the blizzards of 2013 and 2015 which left residents without power and limited essential public transportation options for weeks after the storm. Climate hazards have far-reaching impacts in our community. Some impacts we may recognize immediately, like downed power lines during extreme storms, but others may be less apparent, like the increasing cost to keep our homes cool in the summer with rising temperatures.
How Does Climate Change Affect Danvers?
Climate Projections
Due to climate change, we can expect climate hazards like flooding and extreme heat to worsen in the coming decades. Increasing temperatures and precipitation in the Northeast is projected to create hotter summers, warmer winters, and more frequent droughts. Even though annual rainfall is projected to increase, it will fall in shorter, more intense storms that can cause damaging floods.
Our climate in 2100 could look very different from today, with summer in Massachusetts feeling like a present-day typical summer in South Carolina.
The good news? We have the tools we need to rapidly reduce GHG emissions and prepare for climate impacts to enhance the health, safety, and quality of life of all Danvers residents.
What Can We Do About It?
Reducing Our Contribution
The key to preventing the worst scenario of projected climate impacts is to reduce the amount of GHG emissions that we generate. Reducing emissions is a global effort. Many nations, cities, and states - including Massachusetts - have already set targets to achieve net zero emissions by 2050 in line with recommendations from global experts.
To reduce emissions, we first need to know where they are coming from. In Danvers, the top-emitting sectors are transportation (47%), buildings (43%), and waste (10%). Understanding our emissions will enable us to target policies and programs to tackle GHGs at the source. While we may be making changes to how we get around and power our homes and businesses, there are opportunities to improve these systems while we design emissions out of them. As we reduce emissions, we will work hard to make sure that everyone in town can benefit from a cleaner, healthier, and more sustainable community.
UNIT | Greenhouse gases (GHGs) have a natural heat trapping capacity which varies by gas. Humans produce more carbon dioxide (CO2) than any other GHG. We count emissions of GHGs based on how each GHG’s heat trapping capacity compares to CO2s. This is called the "CO2 equivalent" (CO2e). We measure GHGs in metric tons of CO2e (MTCO2e). | MTCO2eMetric Tons Carbon Dioxide Equivalent |
Greenhouse gases (GHGs) have a natural heat trapping capacity which varies by gas. Humans produce more carbon dioxide (CO2) than any other GHG. We count emissions of GHGs based on how each GHG’s heat trapping capacity compares to CO2s. This is called the "CO2 equivalent" (CO2e). We measure GHGs in metric tons of CO2e (MTCO2e). | MTCO2eMetric Tons Carbon Dioxide Equivalent |
What Can We Do About It?
Prepare for a New Normal
While we need to address the source of emissions, we also need to adapt to the impacts of climate change we are already experiencing in Danvers. To prepare for the 'new normal' of our changing climate we need to understand where and how we are vulnerable to climate impacts.
The Town completed a Municipal Vulnerability Preparedness planning process to assess where our social, physical, and natural systems for vulnerability. Our community identified areas and systems where we can focus resilience efforts, including:
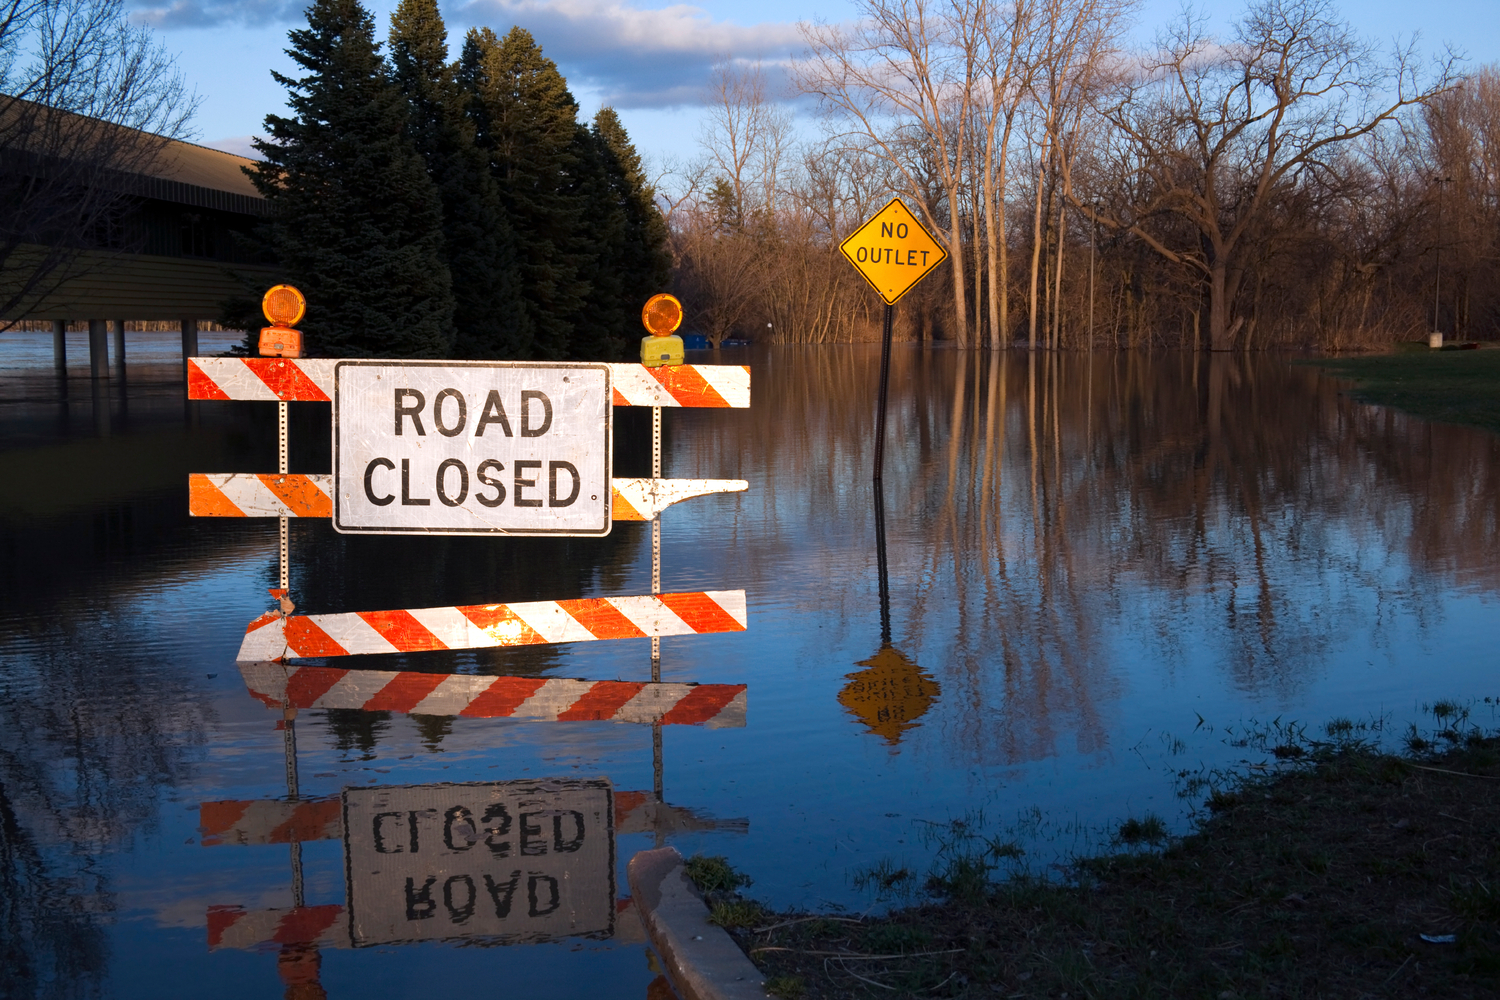
- Roadway flooding
- Emergency response planning
- Natural spaces like Danvers Harbor
The Resilient Danvers CASPR Plan will include actions so our community is more resilient and thrive in the face of our changing climate.
Resources to Learn More
Keep Learning!
Explore these videos, news stories, and resources to learn more about our changing climate and the solutions for a resilient future!